Mental Health in the UK - Makeover Monday | Visualise
This weeks Makeover Monday features a 2018 article on UK mental health statistics.
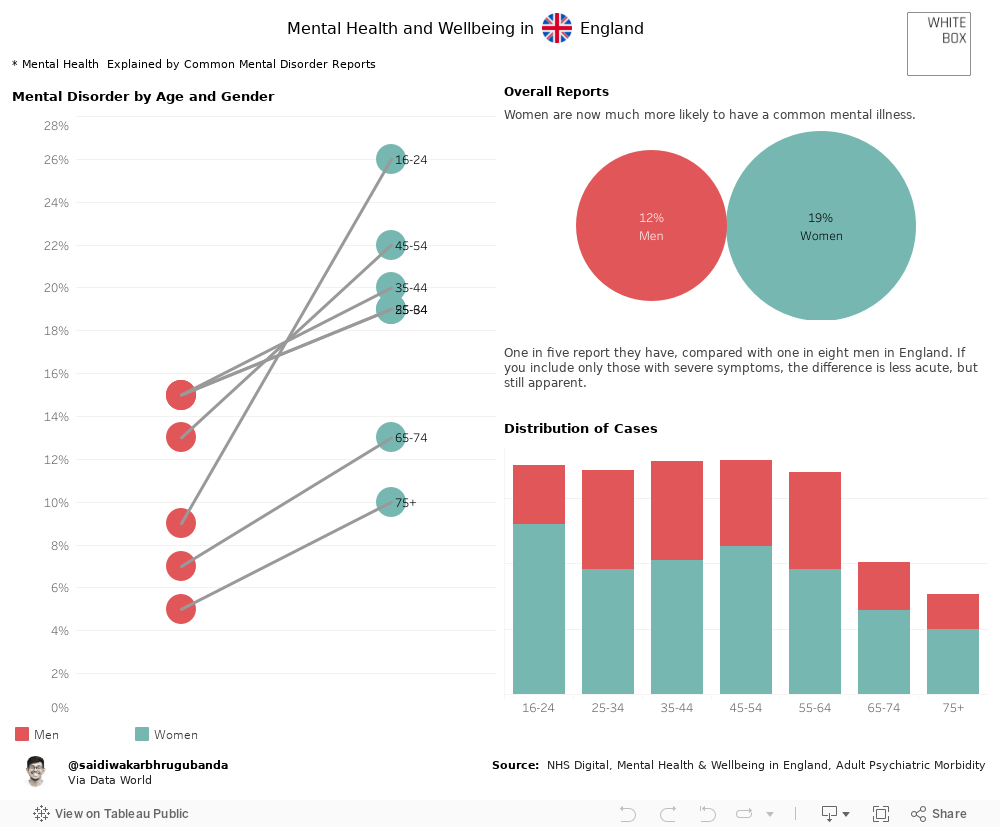
Initially, Junior Data Scientist, Sai, visualised the data set in Tableau, showcasing the stark disparities between men and women reporting symptoms of mentally ill health.
This visualisation paints a clear picture about cases of mental health problems across genders. Despite this, we wanted to delve deeper into some of the underlying issues at hand by using our data research and manipulation skills to discover insights outside of those found in the initial data set.
This led to the further analysis of the original BBC article, where a focus was placed on some of the potential reasons why men were underrepresented in case diagnoses compared to their female counterparts. The results were shocking -
As seen, men represent 75% of suicide cases in the UK. This compared with the fact that, particularly the youngest age group of males, men in general report significantly less cases of mentally ill health, is an alarming finding.
Given that 3/4 mental health problems are established by the age of 24, along with rising rates of people with symptoms, the data clearly highlights that men are still not seeking the help they need. On top of this, the fact that 23% of the National Health Services activity is spent on supporting these cases, only 11% of its total budget is allocated to its related services. This gap could result in more un-diagnosed and unsupported cases, potentially leading to further issues and tragedy down the line.
These data processes are great for anyone to take themselves through. Data in isolation can often give you some insights, but without understanding the greater context of related phenomena, you can often miss the more important details. This is true for business data as well. Having multiple data points integrated can create a clearer picture and allow you to communicate a story with your teams that provides great insight and prompts action taking.
If you’d like help with understanding how best to use your data, then please get in touch.