Visually Interactive Chart Cards - Power BI New Features Update
Visual Tooltips
A long awaited feature of ours here at White Box Analytics has finally been incorporated in the latest update of Power BI’s software - visual tooltips.
For those unfamiliar with visualisation jargon, a tooltip is a window, containing either text, imagery, or a combination of both, which appears when you hover over a specific element within your report. Tooltips are great for diving deeper into points of data to uncover hidden insights and stories without having to navigate away from your current screen. This was a major benefit Tableau had over Power BI but not anymore!
Top uses for visual tooltips
Understand key business metrics and their underlying trends visually
Discover surface level insights more quickly, encouraging faster action taking
Link other report pages by using visual tooltips as a preview to a more extensive set of charts and metrics
Incorporate time based metrics on top of static charts to dive deeper into the trends of key areas of interest
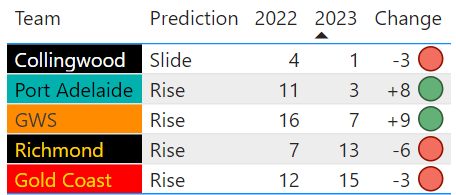
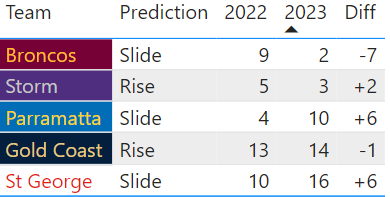
Visual tooltips in action

Source - https://docs.microsoft.com/en-us/power-bi/create-reports/desktop-tooltips
The above capture from Power BI allows the user to drill into individual brands in order to better understand the contributing factors to their position on the headline bubble chart being used.
The great thing about visual tooltips is that they can include (more or less) anything the end-user would like to understand in more detail.
Visualisation with White Box
Power BI is no longer a well-kept secret, but a staple in the digital reporting suites of businesses all over the world. Despite the proliferation of new features and updates making visualisation as powerful as it ever has been, unlocking insights with Power BI is still a struggle for a large proportion of businesses. We know the problem largely stems from one or more of a few main factors including:
Lack of data modelling knowledge/know-how
Lack of available resources to optimise and improve reports
Lack of Power BI training
Limited understanding of the value of data modelling, report optimisation, and visualisation for ongoing business success
Limited understanding of the value of visualisation, but more importantly, the solving of the previous factors mentioned for ongoing business success
If any of these are problems that seem familiar to you, you’re not alone! In fact, you’re likely a thought leader for best practice data usage for your company. Many businesses have these exact problems, either choosing to let them spiral out of control or outright ignoring them.
If you’d your business to become masters in reporting, analytics, AI and more, reach out to our team of experts today for a conversation on how we can help you succeed!
Other updates
New shapes!
New shapes and new formatting capabilities so you can produce reports exactly in tune with your brand and style.
Cross-filter function –
Traditionally, the way Power BI data modelling works means that, in a nutshell, you can only filter values from your primary table into your secondary tables. This limits the ability of the report to filter in one ‘direction’. This feature allows you to filter in both directions, making reports and dashboard overly more functional.
Visualisation for mobile –
there’s nothing worse than a report accessible on mobile that isn’t optimised for its viewing experience. This new feature allows you to reposition and restructure your entire report in a separate mobile view, enabling the best user experience on smaller devices.
Lastly, combo charts now support small multiples!

Source - https://docs.microsoft.com/en-us/power-bi/create-reports/desktop-tooltips
Small multiples allow you to breakdown categorical data on an aligned axis for quick comparisons and an overall view on your metrics of interest.
Interested in White Box Analytics’ visualisation products or support model? Start a conversation with us today to learn more about how we can empower your team.