The Coronavirus and Carbon Emissions
As a result of Coronavirus, carbon dioxide emissions over the past 3 weeks have been 25% lower than for the same period last year.
This has been reflected in the data, with this interesting line chart showing the difference between the 2020 flat line of coal consumption compared to the rebound usually seen approximately 5-10 days after the Chinese New Year.
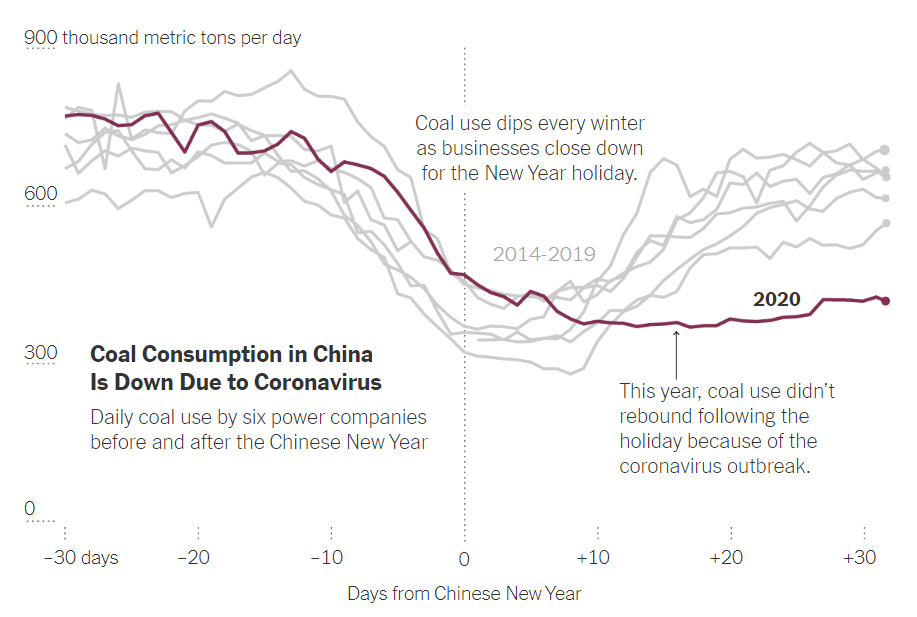
Source: https://www.nytimes.com/2020/02/26/climate/nyt-climate-newsletter-coronavirus.html
To put this dip into better context, the reduction is equal to the amount of carbon dioxide emitted by the state of New York in a full year - approximately 150 million metric tonnes. That is just under a third of what Australia’s entire population produces in an entire year (source).
Despite the positives that often surround reducing emissions, these events have come about as a result of dire circumstances, with over 77,000 cases of the virus now diagnosed. This has had cascading effects on the Chinese economy, with some impacts including:
Reduced output from related industries. For example, car sales are forecast to fall 30% lower than last years levels
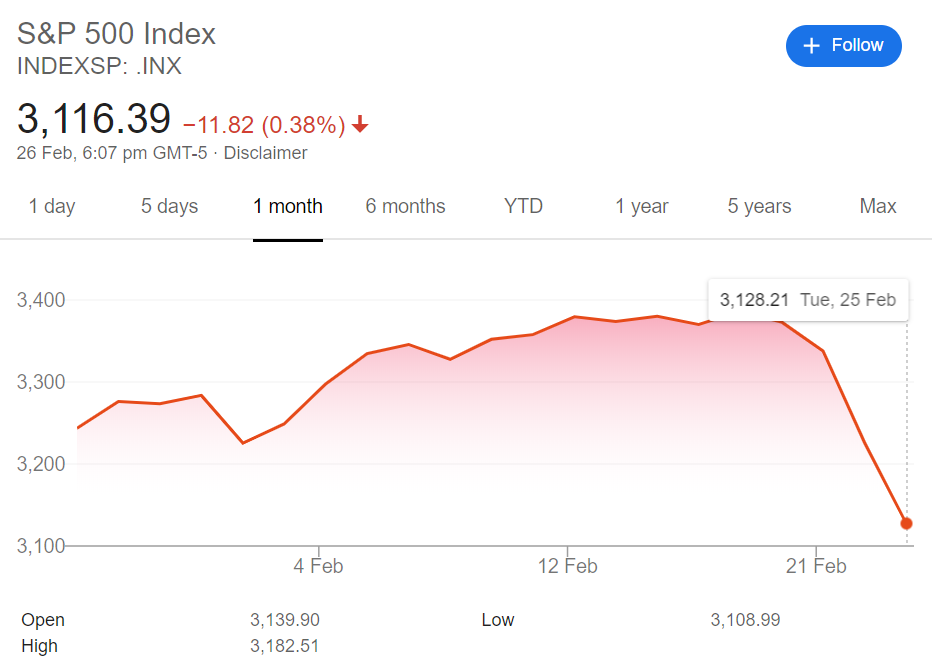
In the past week, economy wide stock indexes, as well as giants including Apple and Microsoft have seen large downward movements in their prices

Even the tech giants have fallen victim to the impacts of Coronavirus, with Apple already decreasing their revenue expectations for the quarter.
‘The industry data provider OAG reports reductions of 50-90% in capacity on routes departing mainland China and a 60-70% reduction in domestic flights within the mainland over the past two weeks, compared with the week commencing 20 January’ (source).
The International Air Transport Association has predicted the virus will cost the airline industry USD $29.3 bn (source)
If you haven’t already, check out the spread of the coronavirus in our latest visualisation here to get the most up-to-date World Health Organisation data updates.
For more data stories, join our community on LinkedIn.