What’s New in Tableau 2022.1 – Part 1
What’s New in Tableau 2022.1 – Part 1
Here at White Box, we use Tableau every day as part of our data analysis and processing solutions. Recently, Tableau released a major update with an extensive list of features, each with their own associated benefits.
While this list contains several small and minor changes, we’re going to take you through some of the most relevant features and updates that we’ve noticed are most useful to us.
So, here’s part 1 of our guide to everything you need to know about the latest Tableau 2022.1 update.
The Top Tableau 2022.1 Feature Updates
There are a lot of great new features now available with Tableau 2022.1. Some of our favourites, and the ones we’re going to be covering today, include:
Workbook Optimizer
Ask Data Phrase Builder
Improvements to View Data User Interface
Let’s get started!
Workbook Optimizer
Tableau uses a workbook and sheet file structure, much like Microsoft Excel. A workbook contains sheets, which can be a worksheet, a dashboard or a story.
Now, the new Workbook Optimizer drastically improves the performance of your workbooks. You can find this feature in the bottom left-hand corner when you go to publish your workbook.
When you run the Workbook Optimizer, it will put your workbook through 12 basic tests to analyse it against specific metrics. It will then return a pass mark or make recommendations to take action based on each of those metrics.
As you can see in the above example, there’s only one field not in use and this won’t impact workbook functionality, so it’s up to you whether to take action.
However, if you had multiple fields that weren’t being used in a visualisation, these could impact performance and create a lot of noise for users, and the Workbook Optimizer would pick up on this and recommend you remove or hide these fields altogether.
Ask Data Phrase Builder
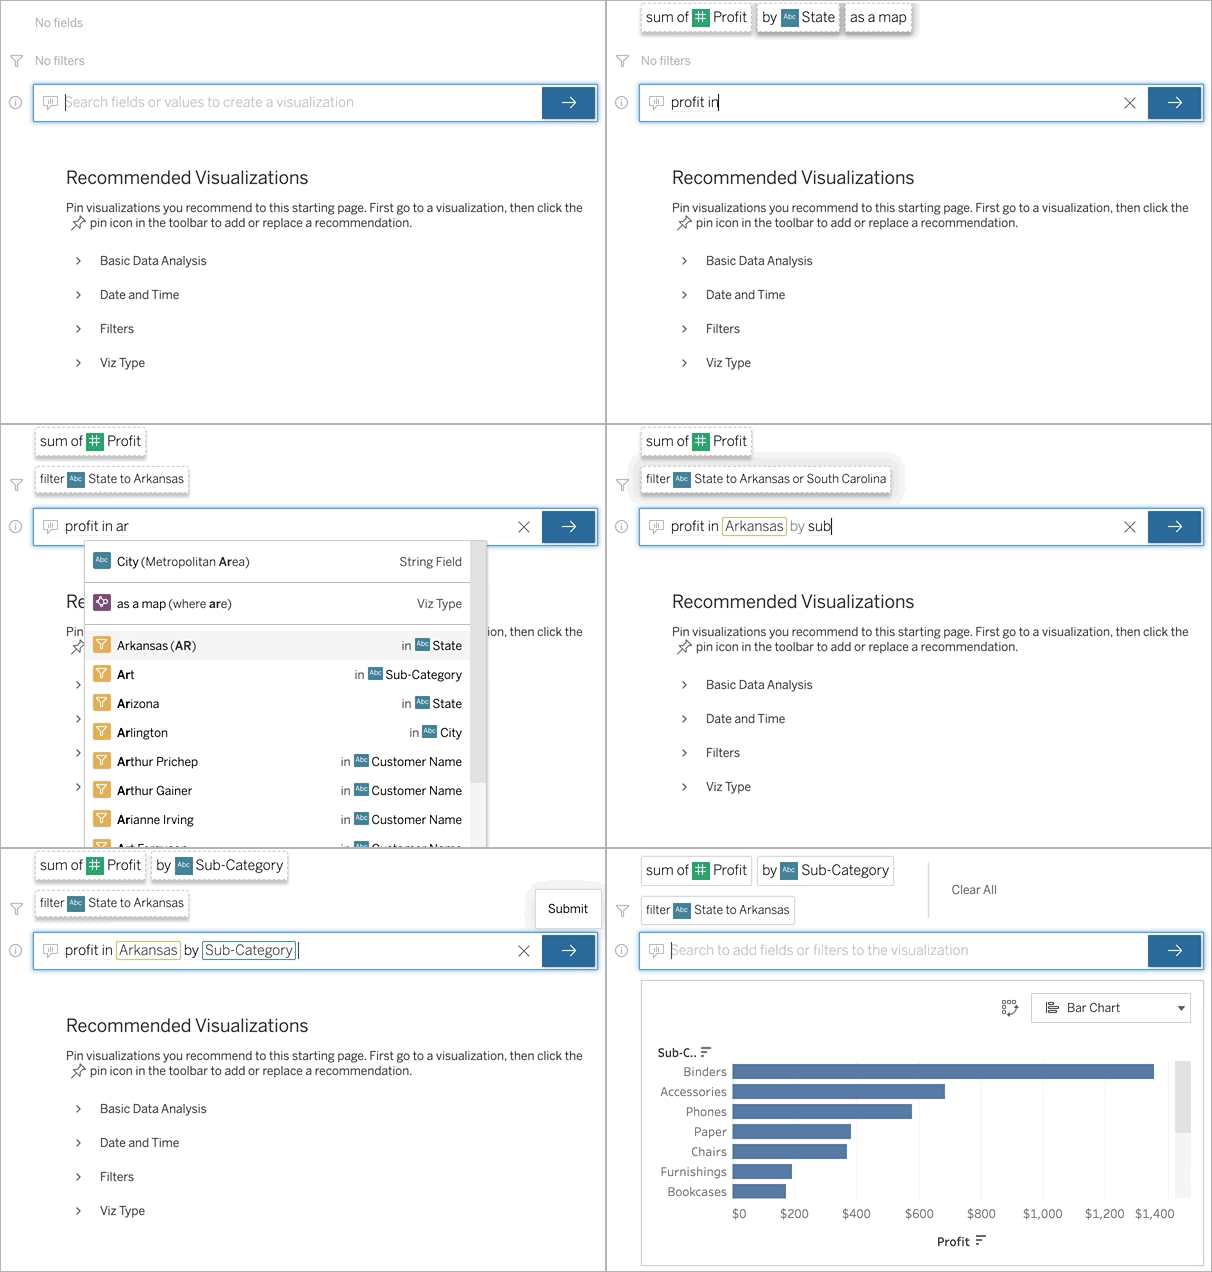
The Ask Data Phrase Builder allows you to type a question in common language and instantly get a response in Tableau. Your answer will come in the form of an automatic data visualisation, with no need to manually drag and drop a field or understand the nuance of your data’s structure.
With Ask Data, you can ask sophisticated questions naturally, with support for key analytical concepts such as Time Series and Spatial Analysis, and an understanding of conversational phrases like “last year”, “earliest” and “most popular”.
See an example below.
To access Ask Data, you’ll need to go into one of your data sets and create a lens. A lens is essentially just a subset of the fields that you have. You can include all fields, but to ensure the most targeted response to the use case, it’s often best to restrict what fields are inside it.
In previous versions, if you wanted to use Ask Data, you had to use the search box. Although this was quite easy to use, it could be a bit overwhelming for users who had not done this before and were unsure what to type.
Now, with the new update, the new Add Field and Add Filter buttons provide an intuitive click-through workflow to help you get the answers you need. The guided workflow provides visual prompts and suggested actions to build your queries (as phrases) with fields and filters relevant to you. The answers to your questions or phrases then come as rich data visualisations that enable you to get the insights you need from your data.
The Ask Data Phrase Builder is available in both Tableau Server and Tableau Online.
Improvements to View Data UI
Improvements have now been made to the View Data User Interface (UI) on Tableau Desktop, as well as the Tableau Online and Tableau Server web edit environment.
When you have a visualisation in a dashboard, you might like to review some of the data before publishing. To do this, you can select certain data in your visualisation and click the View Data button.
While the View Data functionality is not new, those familiar with the View Data window will notice quite a significant change to the look and feel in the new update.
For example, there is now a lot more information about each column, as well as the data source and data type. You can sort the data easily and even move or hide columns as you wish. If you want a copy of the data, you can simply save it as a CSV file.
Find Out More About Tableau 2022.1 with us
We hope you enjoyed our breakdown of the new Tableau 2022.1 update, and next week we’ll share part 2.
For more information on the latest update or to learn more about the Tableau software, contact us today or visit our Tableau Consultant page here.
Here at White Box, we can talk more about your specific needs or run you through a free demo to see if Tableau is right for you.


