Scraping Data from Multiple Sites for Powerful Analysis
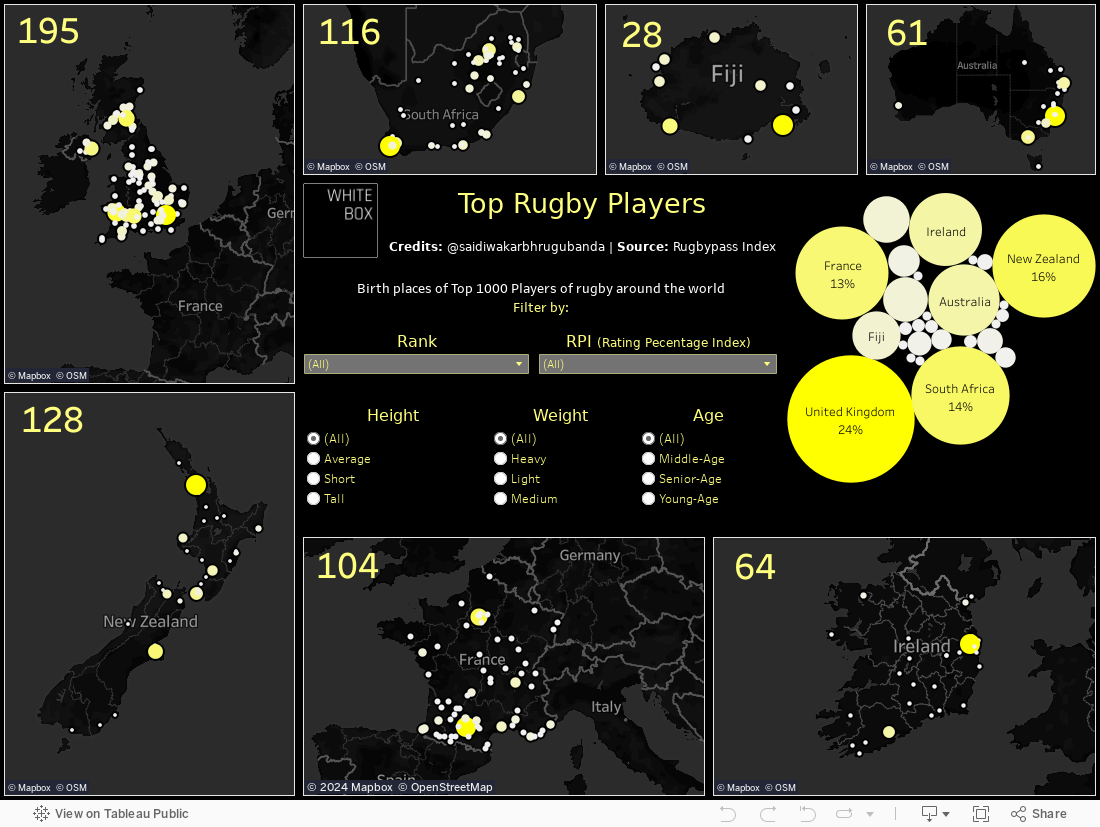
Recently we shared a post on the World’s Top Rugby Players which included the visualisation below. We as a team continually work as together to improve our visualisations and the insights they provide viewers, but the real power behind this particular visualisation was the way Junior Data Scientist, Sai Diwakar Bhrugubanda, used his programming skills to scrape data from multiple sources and produce a collated and dynamic visualisation from these sources.
How it was done
Firstly, a main source of data was identified. This source contains the main points of information we needed to extract for the purpose of producing the visualisation e.g. professional rugby players’ names, height, weight and age.
To be able to extract the information from each players profile, we created a specific program: ‘Web Scrapping Process’.
That code looks like this:

The code is broken down into 4 blocks. Each with the following purpose:
1. & 2. The first two blocks ([5] and [6]) of code utilise the specific web URL and find all Sports Profiles links. Essentially, these two blocks identify the most important data within the website (rugby player profiles that we are interested in).
3. With these links recorded, the third block of code ([7]) extracts the specific link for each player identified from the first process we explained in steps 1 & 2 above.
4. The last block of code ([8]) records each of the individual players’ links, pulling out the relevant information including their height, birth date and position on the field.
But the job wasn’t finished there
The aim of this particular visualisation was to identify the birth places of the top rugby players. We had their positions, heights, ages and Rugby Pass Index - a measure of their overall impact and influence on games and the key indicator to their success in this particular ranking system - but we still needed to identify their place of birth. Searching for each player’s birthplace individually would be way too time consuming, so, using the information already collected, an Excel file with each players name, followed by “birthplace” was created. Then using the Python code below, this program then searched each individual players name followed by the text “birthplace” which consequently extracted the Wikipedia link with their details.
Once each link was found, the Python code drilled down into the link to extract the birthplace of each individual player. That looked like this:

Note: With any automated system like this, you need some manual checks to make sure the machine is doing things correctly.
Then, using his visualisation skills, Sai produced the interactive dashboard in Tableau.
Conclusion
Collating lots of information together in one place is a very useful and often overlooked data analysis process. However, being able to identify data sources that provide you with insightful information about your business, an event or an idea, is one of the first powerful steps you can make to extract the true value from your data.
If you would like help collecting and organising your data to create insightful and dynamic dashboards and reports, please get in touch today for more information on ways we can help you.
To keep up with all things data and White Box, follow us on our LinkedIn page.