Remote Work Report 2020 - Makeover Monday | Tableau
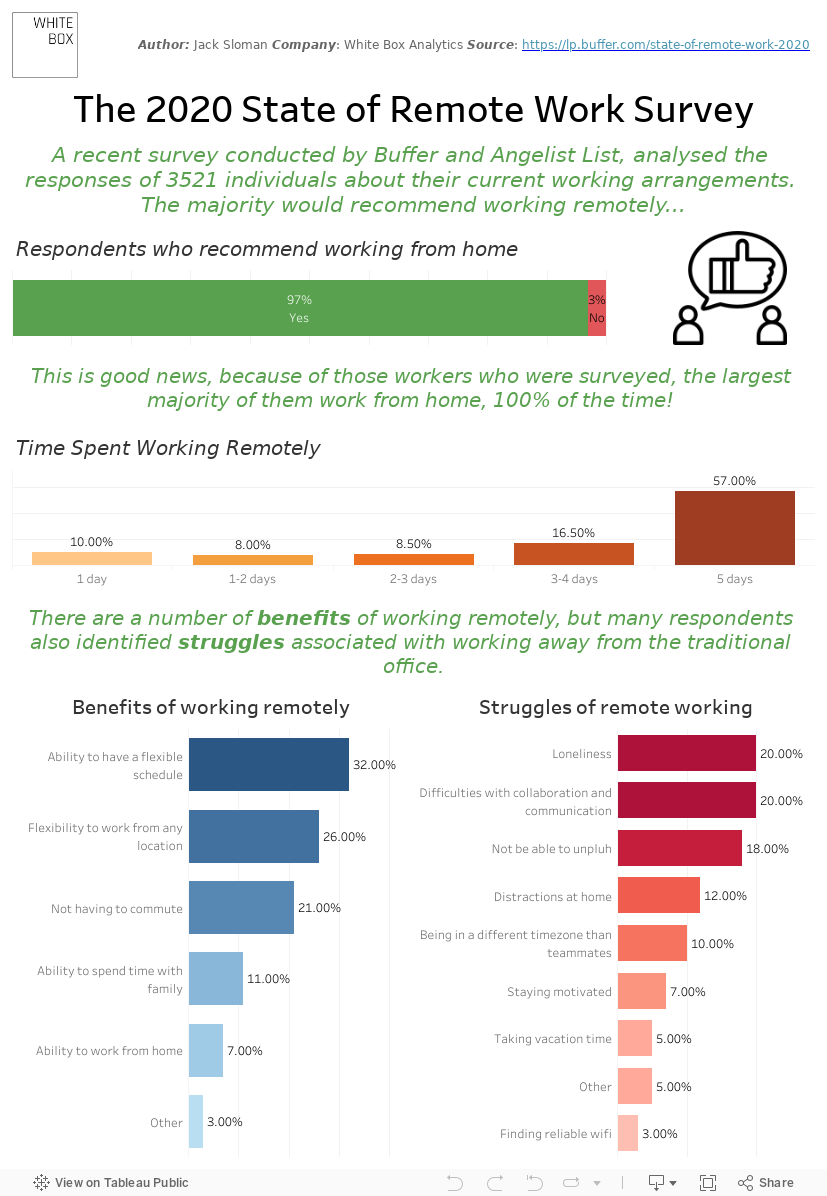
Another Makeover Monday dataset, plus some additional data points pulled from the original report, showcases 3500+ individuals preferences surrounding remote working.
Made with Tableau, this dashboard showcases a story-line of those who recommend remote working in some form, what percentage work remotely and how often, as well as the key benefits and struggles associated with this new working reality.
If you’d like help with understanding how best to use your data, then please get in touch.
Featured