Dynamic axis for multi-view charts | Microsoft Power BI
Dynamic axis for multi-view charts
How often have you taken a step back from a dashboard and thought – too many charts?
Problem is, the client wants them all!
A sleek solution often used by the White Box team is to implement dynamic axis charts for our clients, particularly those in C-level and managerial positions who oversee many functions and operations at once.
Dynamic axis charts are a custom-built solution in Power BI which allow users to toggle between variables on either the X or Y axis of charts. The user can quickly jump between views, without having to jump between report tabs.
Our client needed a CEO-view dashboard of the key metrics of their business. Because of the vastness of the data available, and the multiple points it could be analysed from, they needed a solution which enabled easy navigation between a number of key charts without leaving the main dashboard page.
This was a perfect opportunity to implement the dynamic axis. Utilising upwards of 4 variables on one axis against a fixed variable on the other, they could easily switch to charts of most interest, all in a single, uncluttered dashboard view.
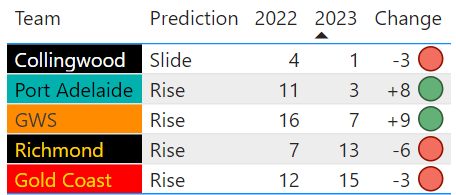
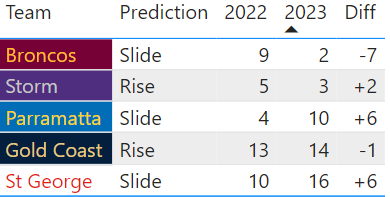
Trial out the dynamic axis chart with this simple example using cricket statistics.
Digital transformation with White Box
White Box Analytics specialises in helping businesses map out their digital transformation journeys with data, ensuring the right projects are completed first in order to provide the framework for more advanced developments in the future. We can help across a range of key areas including:
understanding your businesses goals to create a strategic data roadmap
audit and assess your data assets to understand its potential
data manipulation and modelling
data visualisation and insight reporting
machine learning and AI.
If you’d your business to become masters in reporting, analytics, AI and more, reach out to our team of experts today for a conversation on how we can help you succeed!
Interested in White Box Analytics’ visualisation products or support model? Start a conversation with us today to learn more about how we can empower your team.