AFL Grand Final: the 'premiership quarter' and other myths
At White Box, we don’t mind a bit of sport. If there’s a ball in motion we’ll have a look at it, and footy finals time provides plenty of talking points.
Warning: Here is where you may want to jump off this bus if you’re not a footy or data fan!
The dust has well and truly settled on another season of AFL football, with the grand final playing out last Saturday between Geelong and Sydney. A glorious day for the Cats, thumping the Swans by 81 points and quickly killing the optimistic atmosphere in my Sydneyside venue of choice.
In the wash-up everybody’s an expert
And most rely on some well-worn sporting tropes. Too much experience, inspiration of a retiring captain (Geelong); never risk an injured player in a grand final, they’ll be better for the pain of losing (Sydney).
All fair enough by the way.
Then there are the supposed truisms, the ones that get repeated time and time again because it happened once or twice, perhaps famously, and get locked into the sporting psyche. Well, we’re not ones to deny the truth, but we’ll certainly test it. Let’s look at a couple of golden oldies in the coming days, and see how they stack up against the data.
The premiership quarter
It’s a reference to the third quarter of an AFL match, reputedly the quarter where the cup-winning teams make their move. There’s some strategic logic to it – catching the opposition out after a long half-time break, the advantage of pushing for a big lead as time remaining starts to run low.
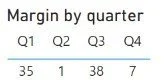
On Saturday, Geelong kicked 39 points to Sydney’s 1, a huge margin of 38. There’s the proof, right?
Not so fast.
The Cats also raced out to a lead of 35 in the first quarter, with the second and fourth quarters more even between the teams, as this breakdown shows.
Q3 still ranks the highest, of course. However, with a weighted approach we can give more context to the match situation. To do this we adjusted each quarter’s margin by a proportion of the prevailing lead at the start of the quarter, to get an Impact score as follows:
Q1 impact = Q1 score
Q2 impact = Q2 score - Q1 lead x 0.25
Q3 impact = Q3 score - Q2 lead x 0.5
Q4 impact = Q4 score - Q3 lead x 0.75
After applying this, the quarters look like this:

Now we have a different picture, with Q1 definitively the best quarter.
In fact, it sits amongst the best – second no less – in the last fifty or so years. By comparison, the third quarter impact sits in 12th place (feature match denoted by size in the charts).

This is the first dent in the ‘premiership quarter’ myth, though not the biggest. We looked at every grand final since 1970 and found that on a pure margin basis, 17 of 53 third quarters ranked highest. This compares with 15 of 53 on an impact basis, a net reduction of two. It just so happens one of those matches was this year’s final.
The other quarters are more heavily adjusted by the impact weighting; the fourth is particularly diminished as blowouts as the dominant team runs away with the match are reduced in value.
The real dent is in those match proportions, regardless of the basis used. If we want to prove that the third really is the premiership quarter, we’d want a much higher proportion of matches in support. The 28% return is barely above a simple arithmetic mean.
Across the grand finals assessed, the dominant quarter was in fact…
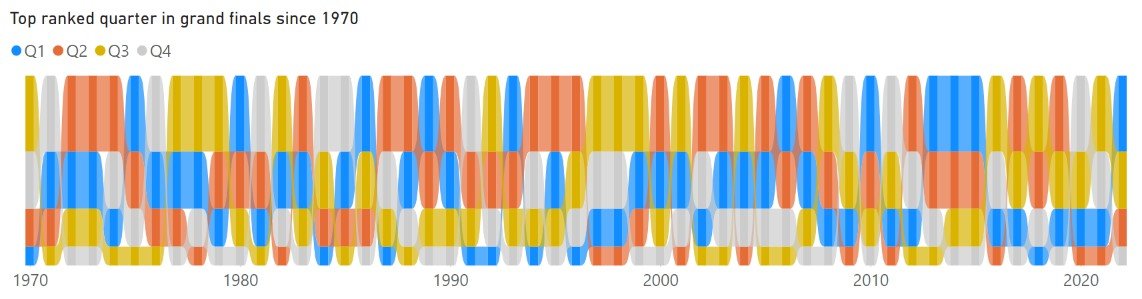
…the second, with 18 of 53. This can be seen in the following ribbon chart, where the years 1970 to 2022 run along the horizontal axis, and the dominant quarter always appears at the top of the ribbon for a given year. The predominance of orange (representing Q2) is apparent at a glance.
It’s fair to say then that the ‘premiership quarter’ is just a myth, or if you don’t want to let go of it, at the very least it isn’t what Geelong experienced on Saturday. Being fast out of the blocks was the winner, and Sydney were blown away before they could get a grip on the game. The silenced punters, including some leaving for home at quarter time, knew it too.
Or….do you disagree?
Is there a better approach to breaking this down? Feel free to share thoughts, debate at White Box is welcome!
Or if this analysis has got you thinking about how ingrained ‘truths’ might be holding your business back…
Let’s start a conversation to see how we can empower your team
As your partner in data analytics and visualisation, we’ll help you to realise the full potential of your data and maximise your business success through advanced and innovative solutions that make all the difference.
Get in touch today for your free data strategy consultation.
Explore more of our data stories:


