Sydney lock-out laws interactive map
Methodology
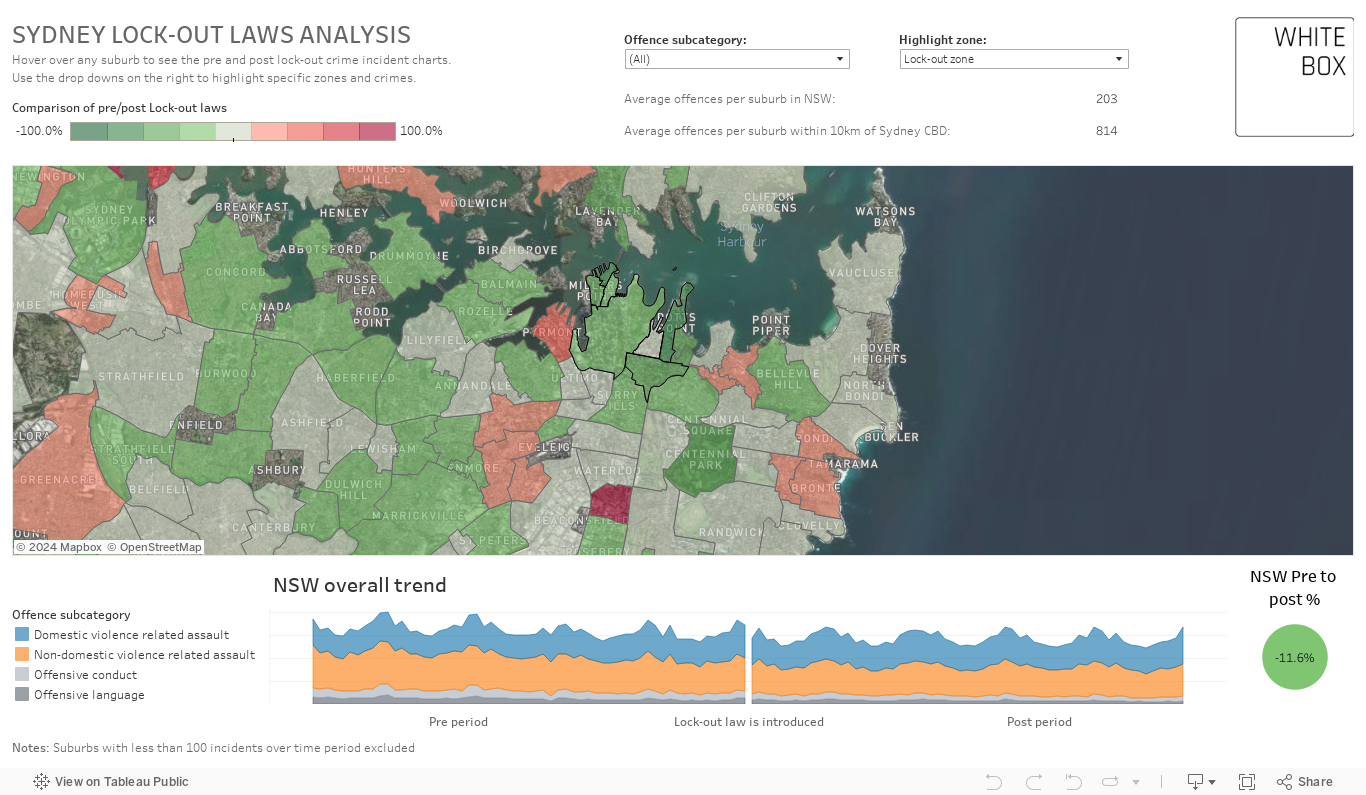
We looked at four key crime offences (domestic and non domestic violence related assault & offensive language and conduct), from 59 months pre lock-out (Mar-09 to Jan-14) compared to 59 months post lock-out (Feb-14 to Dec-18).
Data from Bureau of Crime Statistics and Research.
Highlight zoning includes the lock-out zone, proximal displacement and distal displacement areas.
We have also contextualised by showing the NSW overall trend.
Interactive map
Hover over any suburb to see the volume of crimes before and after the lock-out laws were introduced.
Use the filters at the top to highlight zoning and see specific crimes.
You can also pan and zoom in/out using the options in the map (top left).
If viewing on a mobile device, you can also use this link to view the desktop version.