Our changing climate - Tableau visualisation
November has seen our world leaders gather for the 2021 United Nations Climate Change Conference. The aim of the conference is to establish a global commitment to curb rising temperatures in order to prevent a climate disaster.
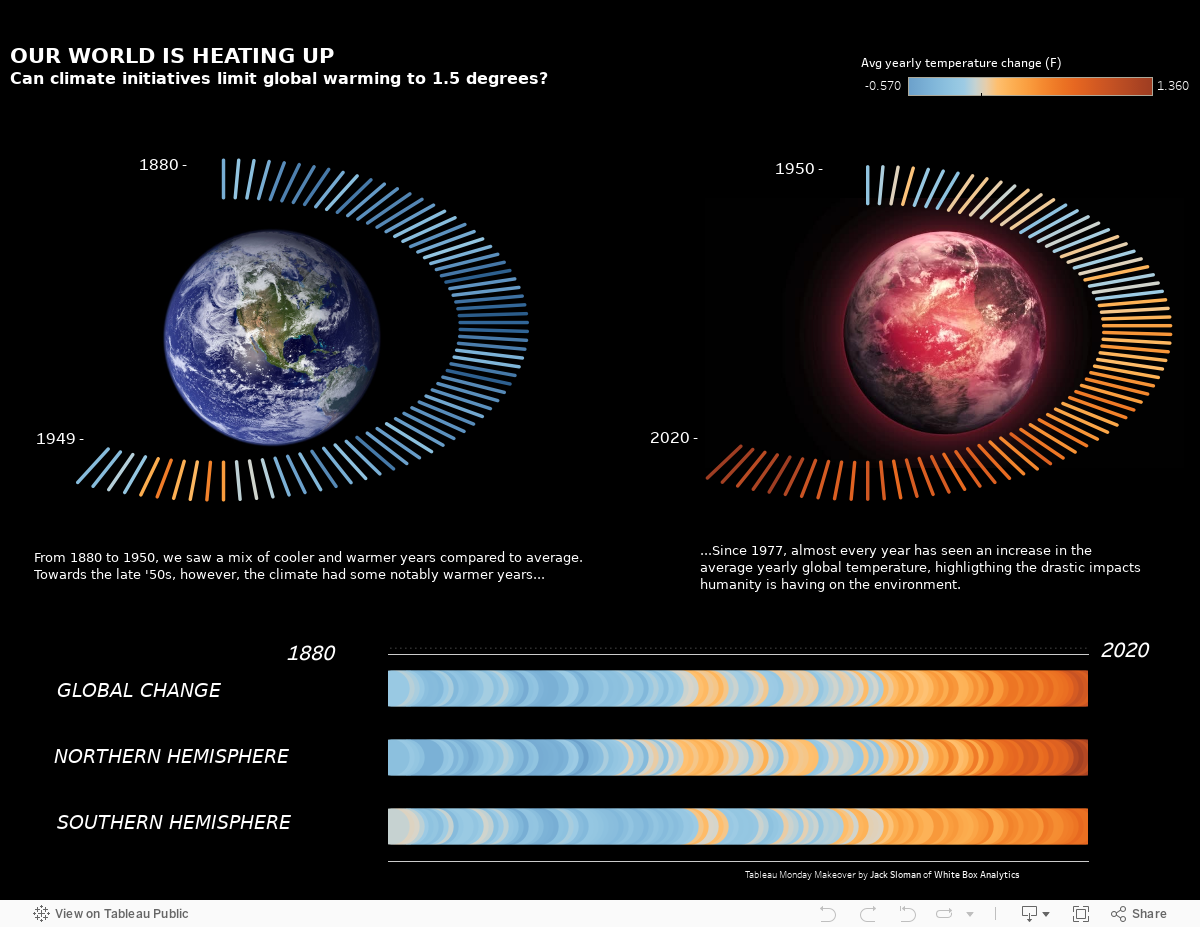
This visualisation uses a dataset from the Tableau Monday Makeover series to understand average temperature deviations from the corresponding 1951-1980 means.
Best viewed on desktop.
Sources: https://data.world/makeovermonday/2021w3 , ShutterStock images.
Interested in creating powerful visuals in Tableau? Find out more about our Tableau expertise, or contact us to discuss your data goals.