“Does one trend of sales predict another and if so, which way around and by how much?”
This was the problem posed by one of our clients.
No matter what type of data project you work on, there are some fundamental steps:
Firstly, understanding the data available e.g. missing values, low volumes and outliers
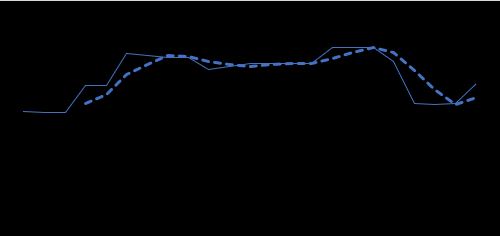
We addressed missing values like so:
Trend with missing points addressed:
Trend with missing data points:


We also wanted to remove the major spikes, as we’re more interested in the overall trend. Normalisation helps with this:
For this project, we used 2 years of data to compare trends (from a total of 5+ years)
We created artificial “lags” between the trends so that we could compare different time frames
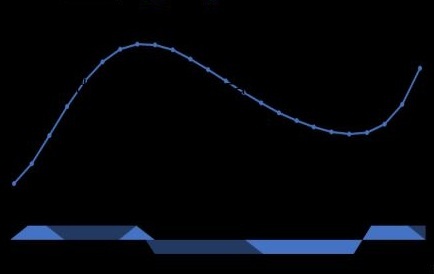
We built polynomial models, which created smoother output trends for comparison
Polynomial trend for property sales
Polynomial trend for vehicle sales:


And we used linear regression models to understand the overall trends e.g. what is the overall direction, going up, down or remaining constant?
There are many methods for assessing time-series trends.
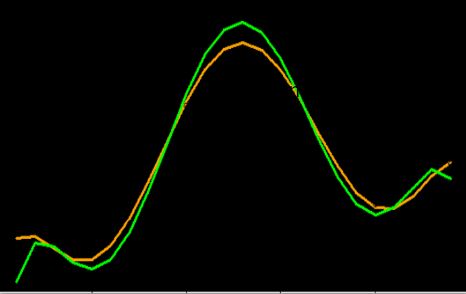
We are looked at the “dissimilarity measure” i.e. how similar/dissimilar are the trends?
Very similar trends:
Some similarities but not the same:

Do they increase and decrease at the same time?

Once we found our methodology, we then set about creating an automated procedure to process the tens of thousands of cases.
We could then derive the best look-a-like models with confidence indicators for further analysis.

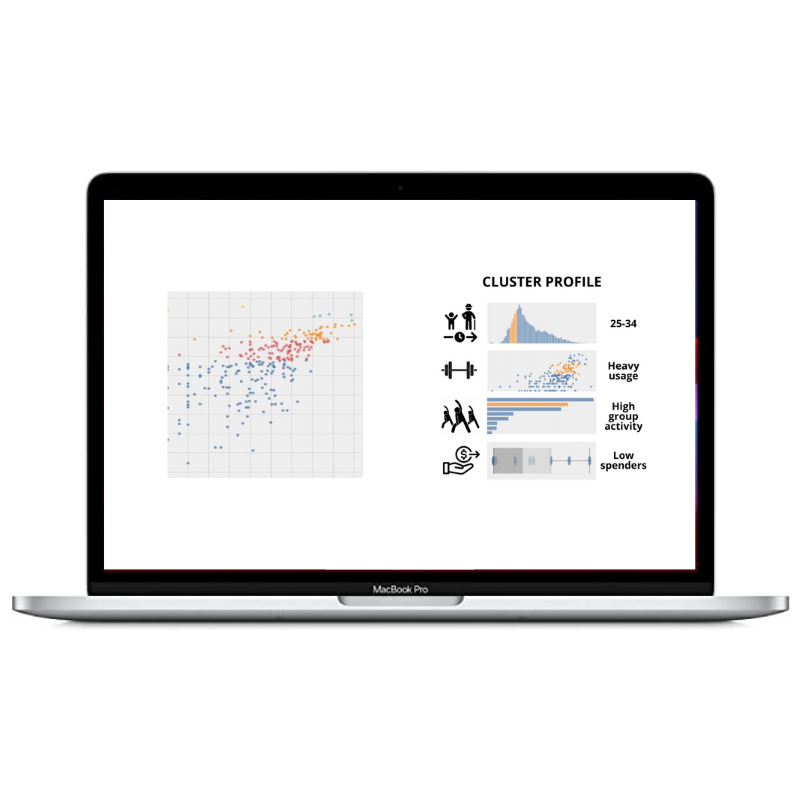
From here, we then had the job of understanding what the different trends meant in real life terms.
Heat maps are great for finding interesting clusters of similar patterns.
The models can now be used to make predictions to test in real life.
Want to know how your business could implement a similar solution? Contact us now to find out more.
Read more customer success stories