Australian Road Accidents
Tableau Visualisation case study
Data Update - final trends from 2020
Our first dashboard issued in Christmas reported data up until September 2020, leaving 3 months to be updated on the government’s quarterly release of road crash and fatality statistics. That data became available recently, so we’ve gone ahead and found some final insights for the year! You can see our original insights below the dashboard under the title ‘Christmas Update’.
“Overall, crash volume reduced significantly”
A reduction in crash volume by over 100 crashes is a positive we can take away from 2020. Let’s hope the statistics of 2020 can persist into the future as Australian’s get back to regular ways of living and working!


“Quarter life crises for 26-39 year olds?”
As a whole, 2020 was a great year for crash reduction…except for one small anomaly. The 26-39 year old age group actually saw a rise in average crashes compared to the previous 5 years. Could lockdowns, redundancies and associated stresses with the pandemic be to blame, or are young to middle aged adults becoming less careful on roads?
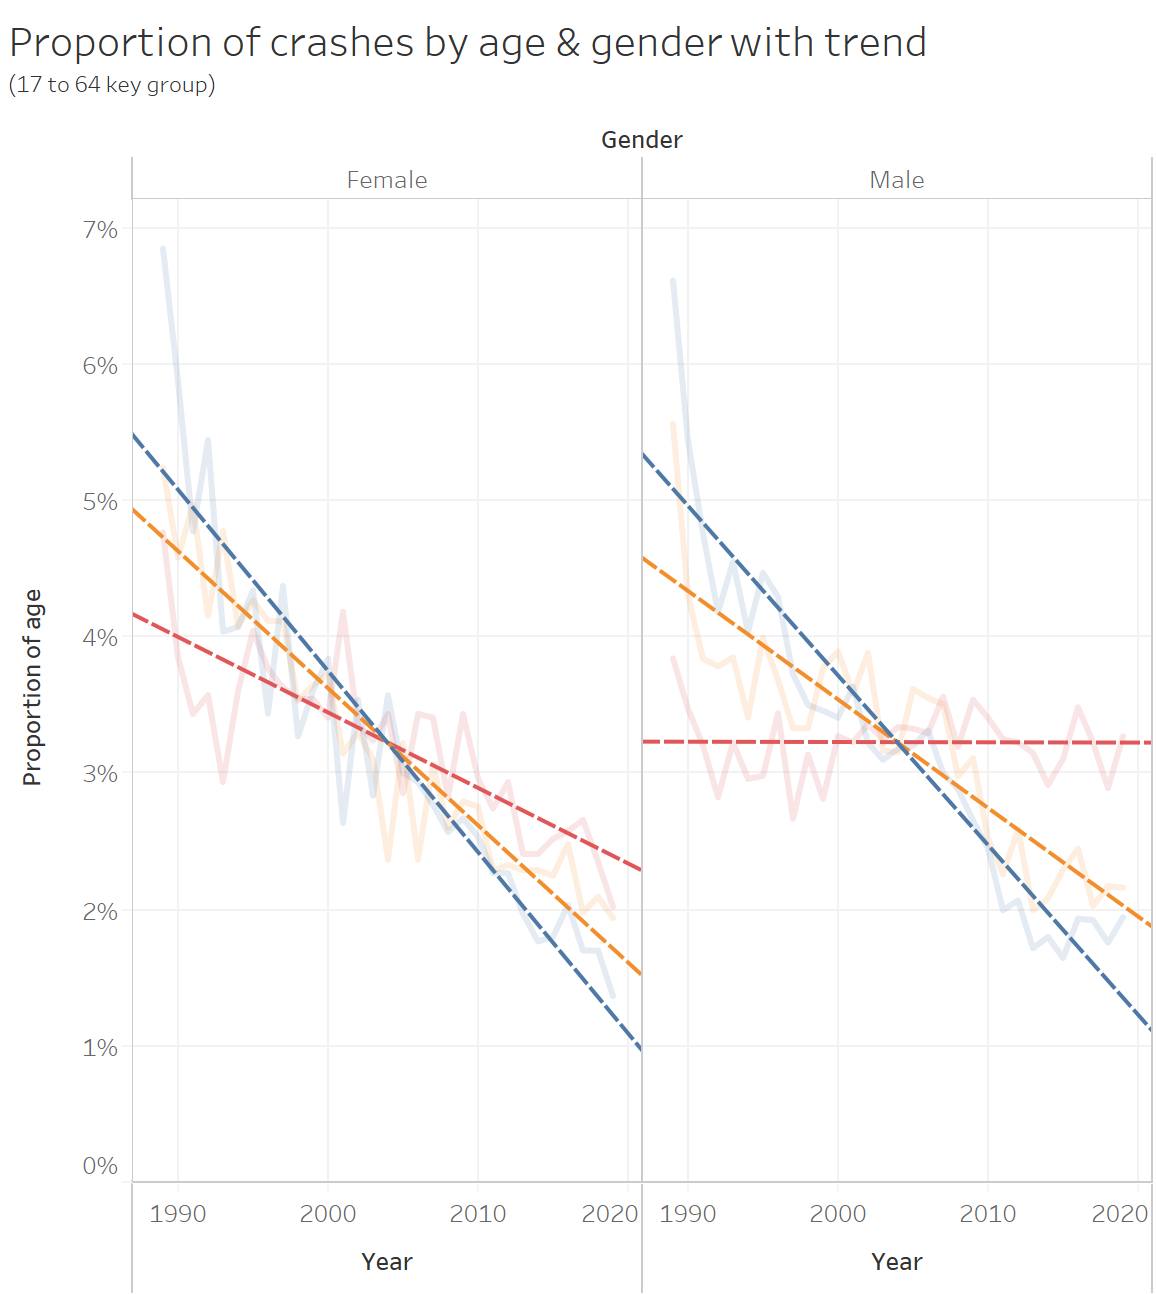
“Younger women in proportionately more crashes”
Let’s not get ahead of ourselves with this insight…Men are still involved in far more crashes. However, in 2020, all female age groups below and including the 26-39 year olds saw rises in their average crashes. The only male group to see an increase was the 26-39 year olds.
Could this simply be chance, or are there other underlying factors to blame for this trend?


“Weekend madness to blame?”
It’s difficult to truly understand what’s causing our last finding, but this insight might provide somewhat of a clue. The anticipation and fun of the weekend can cause the best of us to make irrational or one-off decisions, which might be a contributing factor to the increase in weekender crashes in 2020 amongst females…
Christmas Update
It’s the end of the year! That means festive celebrations, end of year parties, and saying so long and good riddance to what has been an unpredictable, and very forgettable year for many people across the world…
With that being said, in Australia we are lucky enough to be enjoying a relative sense of normality about our day to day lives as we see Covid-19 cases dwindle to extremely low levels. This means we can visit friends and family, shop at malls, go out socialising, hit the coast and celebrate the end of the year in a manner somewhat consistent with what you would expect in a regular year.
Resulting from all of this, White Box team member and Data Analyst, Rohail, thought it’d be a great idea to showcase Australian road statistics involving crashes and fatalities as a way of showing the capabilities of Tableau’s visualisation tool, but more importantly, to keep people just a little bit safer on the roads this festive season. So without further ado, here is White Box’s case study on Australian road crash statistics…
Insights and exploration…
For the best experience, we recommend viewing this visualisation on desktop or tablet.
As you may have already established, there’s a lot to take in from these visualisations…
…but fear not! We’ll break down what we found most telling and insightful about these dynamic charts, to see if we picked up anything you may have missed.
“Friday night madness”

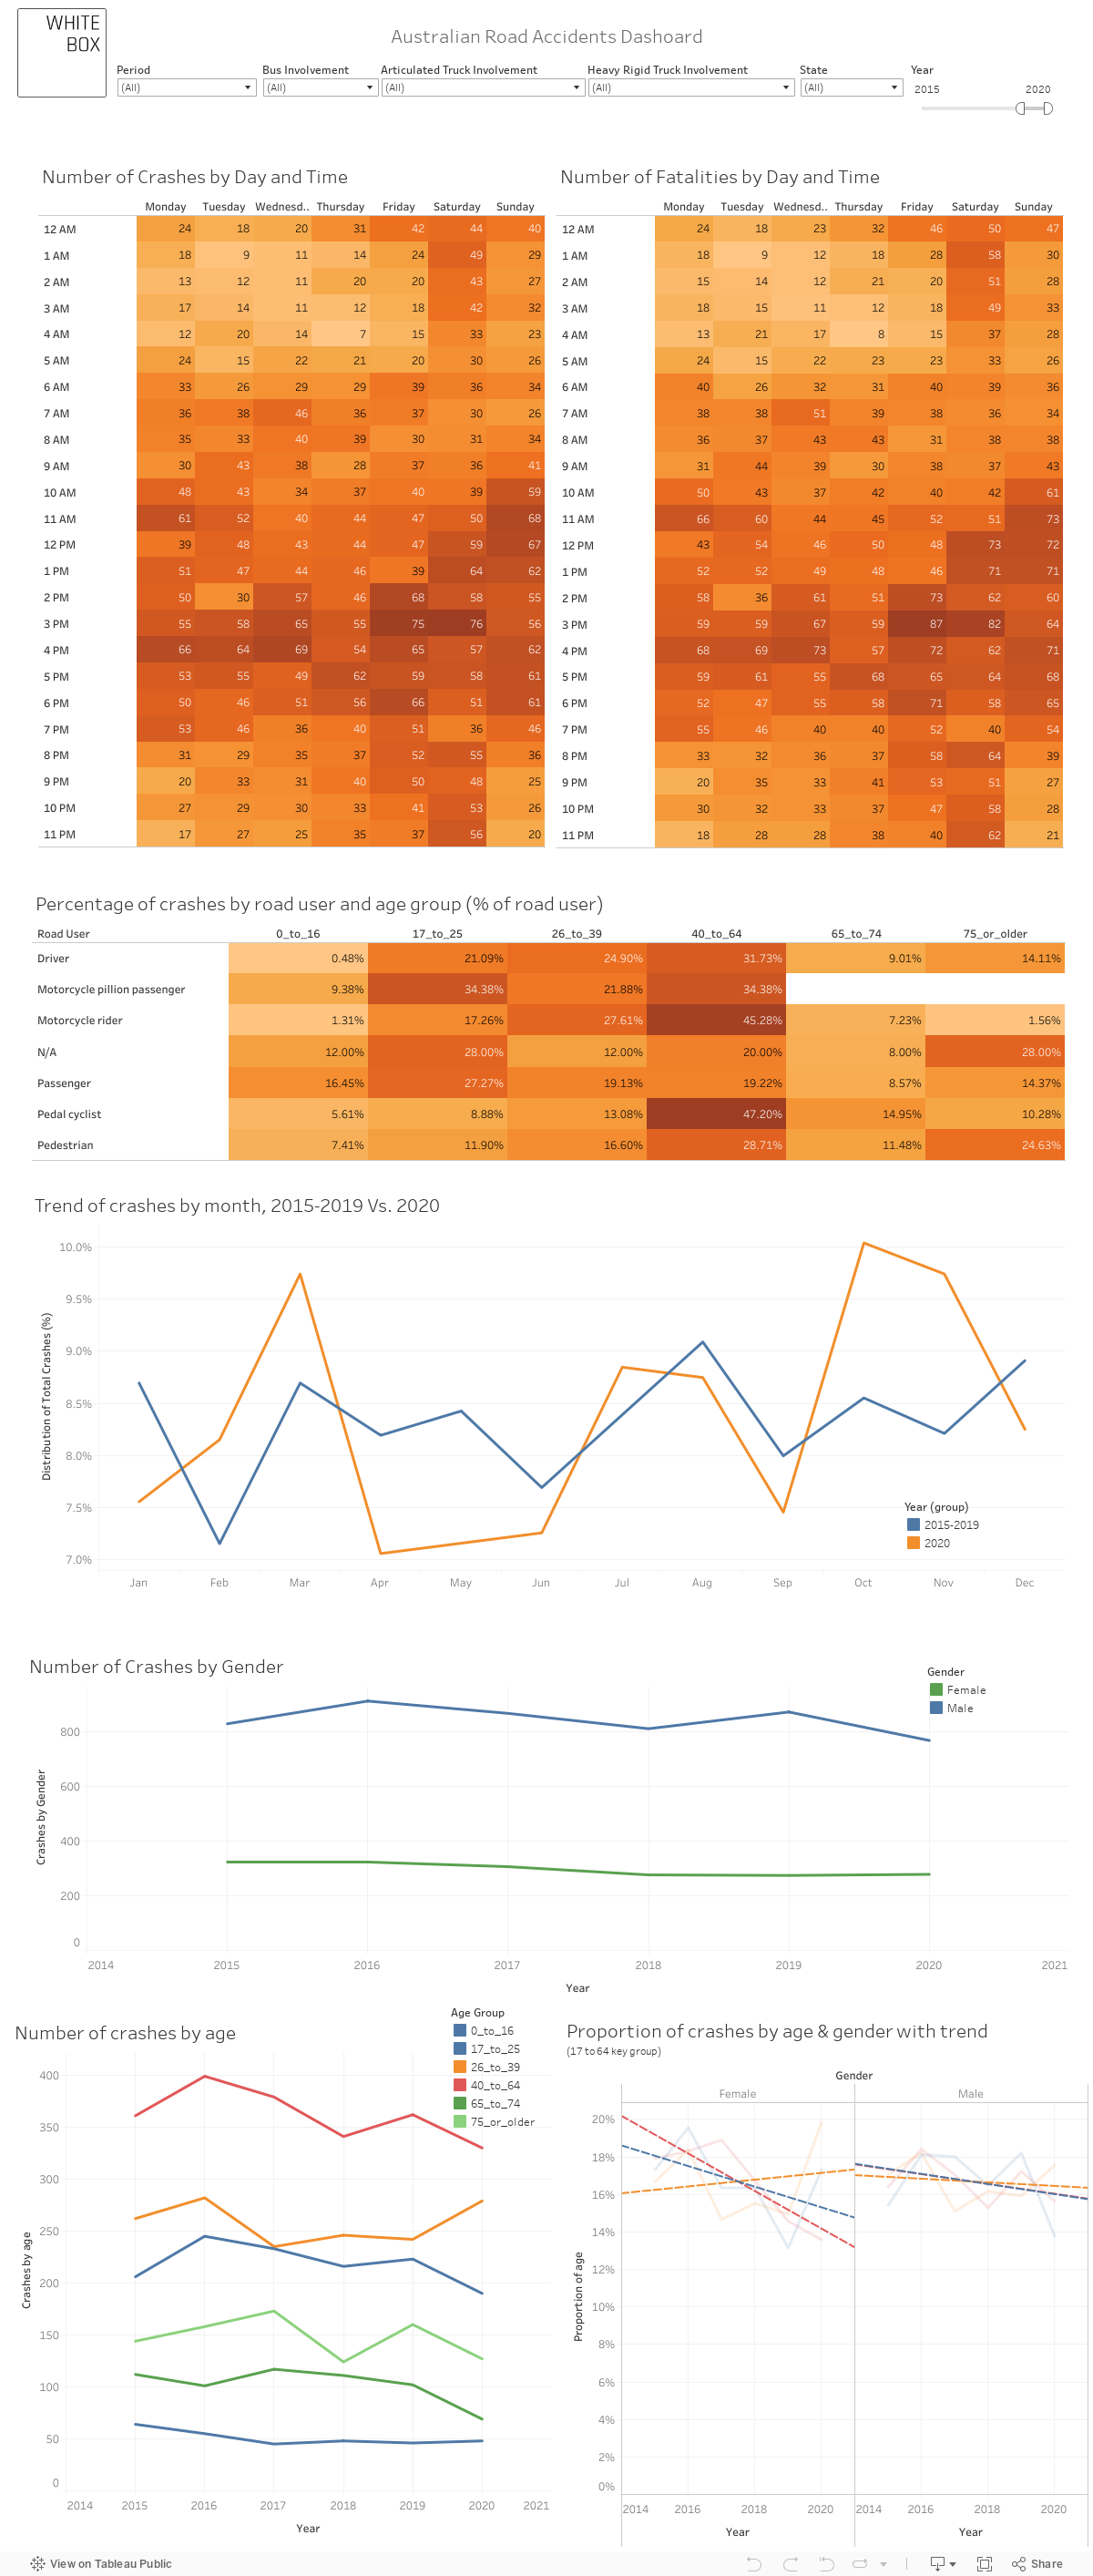
Without much surprise, the most crashes and fatalities happen from Friday afternoon up until early Saturday morning. Worthy of particular note, is Fridays at 3pm for both crashes and fatalities - seeing the highest numbers across the board and sending a strong warning to all those clocking off at this time to be careful on roads.
What we learnt? Avoid the 3-5pm rush hour, and don’t let your excitement for the weekend stop you from getting home safely!
From a road user angle, the number of crashes is spread evenly across age groups 17-25, 25-40 and 40-64. Could this be a misleading insight, however, given that there is likely to be more older drivers, than younger drivers? Scarily, there were 2353 passengers involved in crashes in the 17-25 year old age category alone. This number almost halves when Australian’s reach the 26-34 age category… Does this explain why insurance premiums tend to plummet dramatically around this time, and hire vehicles become much more accessible too?!
“Young people as passengers are involved in a high number of crashes”
“Crashes and fatalities are trending downwards”

Good news! As seen in the total ‘Number of Crashes/Fatalities’ line charts, there has been a significant decrease.
There are likely to be a number of things contributing to this including safer cars and roads, more police presence, and better processes for attaining and retaining a drivers license (think Learners license, Red P’s, Green P’s and all the tests in between!).
The 40 to 64 age group are bucking that positive trend. When we dig a little deeper, we see that it’s men, aged 40 to 64 that are causing the problem. Too many mid life crisis sports cars they can’t handle?
“Mid life crisis sports cars causing issues?”
“Other insights...”
Along with these insights, we also found:
men are involved in far more accidents than women.
despite not being a full year, there seems to be a keel over apparent for total 2020 accidents. This could potentially be attributed to Covid lockdowns and the general lack of travel and commuting that’s been done in relative terms
the most fatal crashes with buses involved happen on Monday’s at 10am, although buses are involved in a very low number of overall accidents (use the filter to explore yourself!)
of the crashes involving heavy rigid trucks, 40-64 year old drivers dominate the drivers involved.
New South Wales and Victoria see the highest number of crashes
The DAta - Structure, Visualising, Challenges
The first challenge was to find a well structured dataset. Given the extensive nature of government data that is publically available, two sets of data were found here, which formed the base of the analysis.
The first data set detailed the number of crashes, and the second by number of fatalities.
Joining the crash and fatality data sets
The challenge then was to join both datasets. There were two methods to do that, by creating a direct relationship between crash id’s, or, conducting a full outer join. Rohail used a full outer join in this case.
Choice of visuals
To select the type of visualisations used in the dashboard Rohail made multiple, and selected those that represented the information in the best possible manner. This is the creative aspect of data visualisation we love, as it allows for multiple avenues of exploration and enables you to unlock many insights which, particularly when it comes to client-side data, can be extremely eye opening and therefore valuable.
Worthy of mention here is that there is always a lot of low-hanging fruit to be had in these stages, and you don’t need to extensively analyse every single piece of data (at least initially) to generate some really powerful insights.
Challenge
There were multiple instances of the same crash id’s (numbers which identify an individual crash event in the data) in the data when it involved multiple vehicles. This can create duplication issues, so to keep an incident as a single count Rohail used the distinct count function in Tableau to eliminate potential problems arising from this.
Our goals with the study…
These case studies are a great way to explore some of the amazing ways to visualise data in Tableau, whilst providing compelling insights to those interested in the topic at hand.
We hope, like with all of our projects here at White Box, that you gain value from this visualisation, or learn something you didn’t know about Australian road statistics and how crashes and fatalities are distributed among states, genders, months and times throughout the week.
Read more customer success stories